by brian d foy for Dr. Dobbs Journal
In my last article I showed you how to profile your code using
the Devel::SmallProf
module which gave you times and counts per line of code. In
this article we will go further than that by making code graphs
with that information by using the Devel::GraphVizProf
module.
A graph, in this sense, is a collection of connected nodes. The nodes, in code graphs, are the executable statements of the program and are connected by "edges" which show the flow of code from one statement to the next. This sort of graph is also know as a "directed graph" since the edges show the direction of flow from node to node.
GraphViz
is an open-source graphing program developed by AT&T which can
help developers visualize structural information, such as code
flow, database
table relationships, or the links between web pages. GraphViz
and many other
interesting tools are provided free of charge by AT&T. The
ease of installation of this package can depend on your
operating system. On FreeBSD simply go to
/usr/ports/graphics/graphviz and run make
install then go off for a cup of coffee. Installing GraphViz
is a bit more involved on Red
Hat Linux due to some incompatibilities mentioned on the Graph Visualization Project
development site. There appears to be an initial version
for Windows but I have not tried it. Programmer beware!
You can get Devel::GraphVizProf
from the Comprehensive Perl
Archive Network. It is in the GraphViz
module distribution by Leon Brocard who also presented a talk
about Perl code graphs at YAPC::Europe 2000. It does not install
automatically as of version 0.12 but all that you
need to do is copy the Devel directory to an
appropriate Perl library directory. If you have not done this before or
cannot install modules into the Perl library directories,
perlfaq8
can help you figure out what to do. Although you may suffer a
bit more while installing this module, the coolness factor is
worth the pain.
GraphViz can do quite a bit and comes with more tools than I will show, but you can see the documentation for more details. To show a simple code graph, I wrote a sample program that does not do anything useful,
	#!/usr/bin/perl

	my $test = 0;

	while( $test++ < 15 )
	        {
	        my_print("Hello $test\n");
	        }

	sub my_print
	        {
	        print $_[0];
	        }
|
and then I wrote the graph description of it. Each
executable statement is defined as a node and the edges are
defined as connections between them. In this case, I connect
statements that follow each other during program execution.
Rather than discuss the dot syntax here I refer
you to the dot
documentation so I can get on with the cool stuff. Later
the Devel::GraphVizProf
module will do all of this for me.
	digraph test {
	        bgcolor="white";
	        node2 [color="0,1,0", label="my $test = 0;"];
	        node4 [color="0,1,0", label="my_print(\"Hello $test\n\");"];
	        node3 [color="0,1,0", label="print $_[0];"];
	        node1 [color="0,1,0", label="while( $test++ < 15 )"];
	        node2 -> node1 [color="0,1,0", len="2", w="0"];
	        node4 -> node3 [color="0,1,0", len="2", w="0"];
	        node3 -> node1 [color="0,1,0", len="2", w="0"];
	        node1 -> node4 [color="0,1,0", len="2", w="0"];
	}
|
Once I have created the nodes and connect them with edges, I
transform the graph description into an image with the
dot utility that comes with the GraphViz
distribution. This program can produce output in several
formats including Adobe PostScript, FrameMaker MIF, PNG, and many
others. For this article I will use PNG so you can see
the images. To generate the image file, I tell
dot which output format I want with the
-T switch and what the output file name is with
the -o switch along with the name of the file
which has the graph description. The -G switch allows me to
specify options for the entire graph. In this case I want the
color of the background to be white. You might not need this, but
if you get an image full of black, that probably means GraphViz does
not know which color you want to use for the background and uses
black by default.
prompt$ dot -Gbgcolor="white" -Tpng -o example.png example.dot |
The image shows the graph that I created.
I can also change the color of the edges so that I can encode more information in the graph. The color of the edge can be used to indicate how often the program goes from one statement to another. I can then literally see the parts of the program that might deserve more consideration for optimization or debugging. In this example I have colored the lines involved in the loop blue to indicate that they execute more often than the other lines.
	digraph test {
	        node2 [color="0,1,0", label="my $test = 0;"];
	        node4 [color="0,1,0", label="my_print(\"Hello $test\n\");"];
	        node3 [color="0,1,0", label="print $_[0];"];
	        node1 [color="0,1,0", label="while( $test++ < 15 )"];
	        node2 -> node1 [color="0,1,1", len="2", w="0"];
	        node4 -> node3 [color="0,1,1", len="2", w="0"];
	        node3 -> node1 [color="0,1,1", len="2", w="0"];
	        node1 -> node4 [color="0,1,1", len="2", w="0"];
	}
|
I already know that the Devel::SmallProf
module can count the number of times the a line of code is
executed and how much time it takes to execute that line. The
Devel::GraphVizProf
module does the same thing. Rather than output a text report
like Devel::SmallProf
does, Devel::GraphVizProf
outputs a graph description. It uses the edge color to encode
the line counts. Statements that are connected infrequently
relative to other statements are colored darker and statements
that are connected more frequently are colored more brightly.
In this example, the edges that are black only happen a couple
of times while the ones colored blue happen very frequently. I
can easily identify where my program is spending time by
looking at the colored lines rather than going through lines of
test input. The power of pictures becomes apparent.
I modified the example script to add some lines of code that will be executed more
often than those in the while loop to show how Devel::GraphVizProf
displays relative frequencies of execution.
	#!/usr/bin/perl

	my $test = 0;

	while( $test++ < 100 )
	        {
	        my_print("Hello $test\n");
	        }

	my $sum = 0;
	foreach( 0 .. 1000 )
	        {
	        $sum += $_;
	        }

	sub my_print
	        {
	        print $_[0];
	        }
|
I run this script under the Devel::GraphVizProf
debugger by using the -d switch.
prompt$ perl -d:GraphVizProf example.pl |
At the end of the program the debugger prints to standard output the
information that I can pass to dot to create the graph. I can
send the output to dot directly, but often the program I graph
sends other information to standard output or I want to change the node information
a bit. I save the information in a file until I am ready to make the graph.
prompt$ perl -d:GraphVizProf example.pl > example.dot |
I then edit out any extraneous output from the program and add any extra features I might want in the graph (such as background and foreground colors). Once I am satisfied I make a PNG image of the graph as I did before.
prompt$ dot -Gbgcolor="white" -Tpng -o example.png example.dot |
Look at how large that image is though (118k and 5052x2751). It is large not only in file size, but in dimension. The interesting code only takes a small portion of it since a lot of the code that I see in the image is from the parts of the debugger program which actually creates the image.
I don't want to see all of that. I can limit the graph to
particular namespaces. If I want to limit my graph to the
statements in particular namespaces, I can create a
.smallprof file in the same directory from which I
will run the program. The .smallprof file is
included in the Devel::GraphVizProf
module at runtime with do {}, so I can put valid
Perl statements in there. If I create a hash named
%DB::packages, Devel::GraphVizProf
only profiles packages which exist as keys in that hash and
have a true value (which is anything that is not 0, the empty
string, or undef) will appear in the code graph.
By default, Perl programs are in the main
namespace (or package) which corresponds to the main() loop in C. If I want
to profile and graph only statements in the main namespace, I can use this
.smallprof file.
$DB::packages{'main'} = 1;
|
I then rerun the debugger and redraw the graph which turns out much smaller and easier to read.
prompt$ perl -d:GraphVizProf example.pl > example.dot prompt$ dot -Gbgcolor="white" -Tpng -o example.png example.dot |

The new image is much smaller and only shows the code of interest. Notice that the lines the execute more often are connected by lines that are brighter colors. If I had a much longer program, and a much larger code graph, I could easily scan the image looking for the brightest colored lines to see where the program is spending its time. Although this is not going to unlock the secrets of my program, but I can use the graph along with other information to decide how to optimize or debug it.
Just for kicks, I ran the test.pl script
from the Business::ISBN
module under the Devel::GraphVizProf
debugger using a different .smallprof file
so that I could also profile code in the Business::ISBN namespace.
	# the naked block defines the scope of the @modules array.
	# i don't want to mess up the rest of the program ;)
	{
	my @modules = qw( main Business::ISBN );
	@DB::packages{ @modules } = @modules;
	}
|
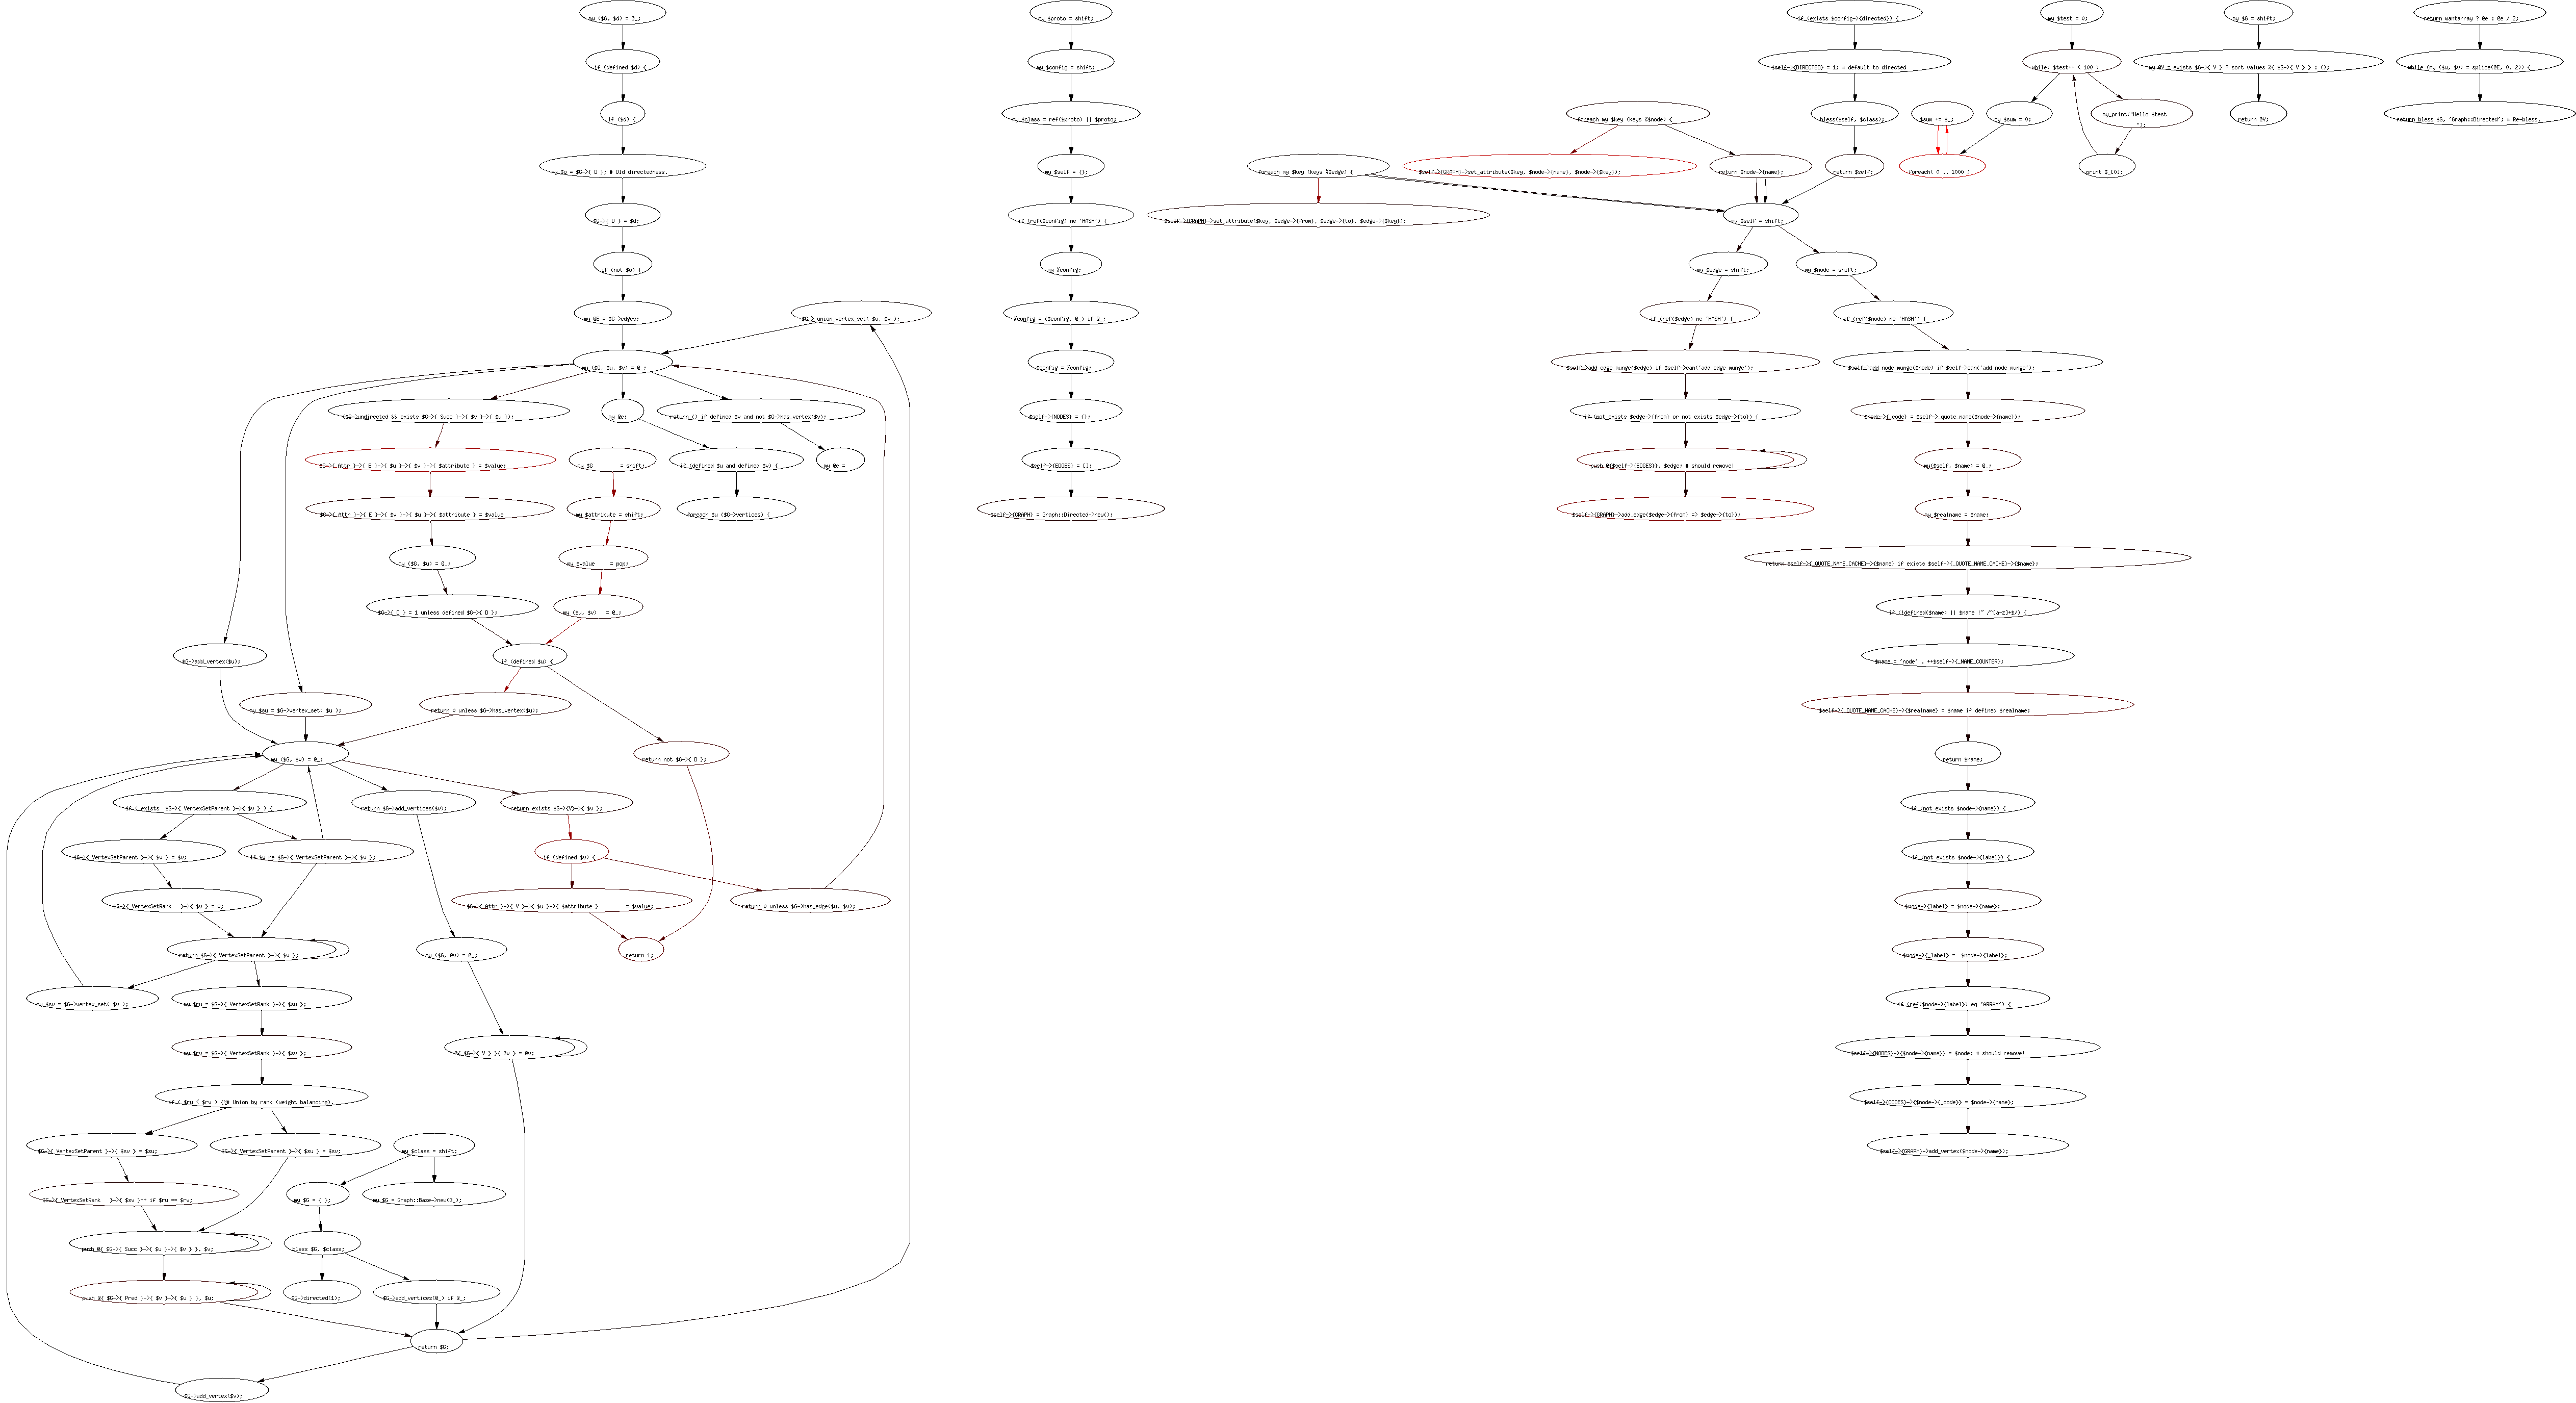
The code graph generates a rather large image of the program (312k and 7866x6068).
There is a lot more that you can do with GraphViz to make these graphs prettier, but that is up to you. You can install prettier fonts, use different colors or outlines, and all sorts of other things to justify the use of a really expensive printer. Just do not tell your friends and coworkers how easy it is to do. :)
__END__
brian d foy has been a Perl user since 1994. He
is founder of the first Perl users group, NY.pm, and Perl Mongers, the Perl
advocacy organization. He has been teaching Perl through Stonehenge Consulting
for the past three years, and has been a featured speaker at
The Perl Conference, Perl University, YAPC, COMDEX, and
Builder.com. Some of brian's other articles have appeared in
The Perl Journal.